Learn about your organization's bug practices and how they've changed over time.
Trend

This metric shows the percentage of issues closed during the time period that were bugs. An issue is considered a bug if it has an issue type that contains the term "bug" or "defect". Each dot on the line represents a week during that period.
These trends show the total bug rate, and the top 10 groups with the highest bug rate in this period.
All bugs counted here are currently assigned to the selected segment.
Group Options
By default, groups are based on manager, but can be pivoted by other options such as by project, priority, or role.

Closed Bugs
View the count of bugs closed each week (the trendline) compared to the total number of issues closed.
Opened Bugs
View the count of bugs opened each day of the selected time period. This view helps you understand patterns and spot unusual spikes.
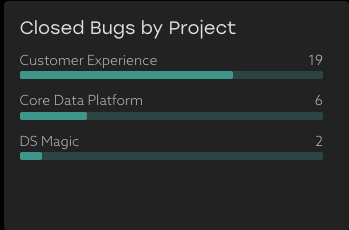
Closed Bugs by Group

Use this view to understand the bug count for each group for the selected time period.
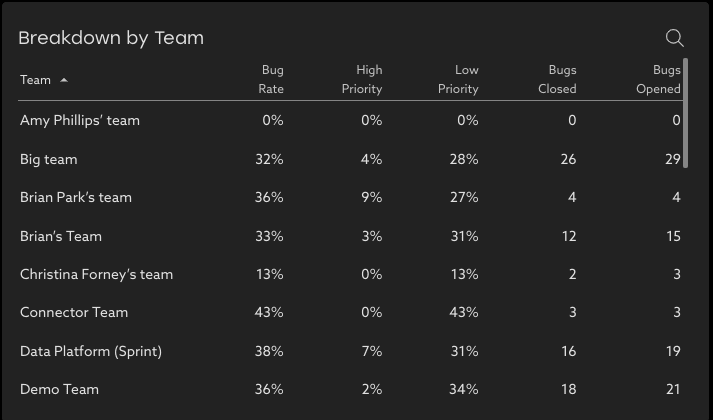
Breakdown by Group
See the bug activity for the period for each group to understand where load balancing could be beneficial.
Bugs are counted against the group they are currently assigned to.
Detailed Drill-in
See the individual bugs behind these insights by clicking View All or a group in the breakdown table.

Filters
Advanced filtering options allow focusing on the trends of specific projects, issue types, or groups with highest or lowest bug rate.


