How quickly are we deploying to production?
Leverage your CI/CD data to understand your organization's deployment practices
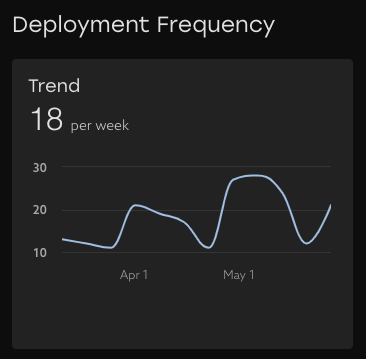
Trend

See your organization's deployment trend over time. This chart shows the number of successful deployments to production in the date range selected.
💡 Tip: the main thing to look for is consistency here. Deploying often benefits teams in keeping practices and procedures smooth and repeatable.
Success Rate

Observe how frequently your teams' deployments are successful across all environments with successful deployments shown in blue, and unsuccessful deployments shown in pink. If there are groups with lower-than-average success rates, then having a conversation about why those deployments are consistently failing may highlight some areas for improvement.
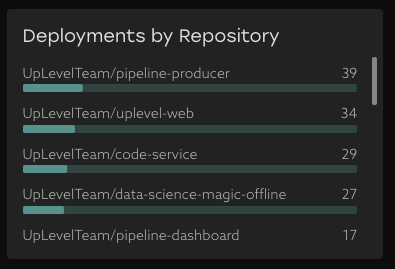
Deployments by Repository

Understand where your teams are deploying changes. This chart shows the top repositories and the percentage of deployments that were attributed to them. The length of the bar shows the fraction of deployments to this repository out of all deployments to production.
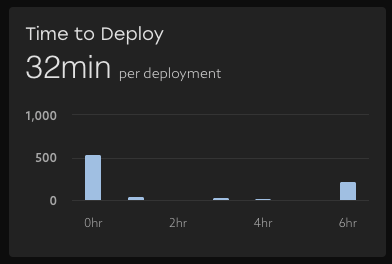
Time to Deploy

Understand how long deployment jobs are taking. This metric is calculated using the start and end timestamps of the respective workflow run. This could include build time as well, depending on how your CI/CD Workflow is configured.
Breakdown by team
Explore the data to learn how frequently teams successfully deploy code, how often deployments go to production environments, the success rate of deployment workflows across all environments, as well as the median time it takes workflows to run. This table can be pivoted both by people properties like team and report group, as well as Repository.
Note that Uplevel attributes deployments to both the person that initiated the deployment workflow, as well as authors of PRs that were included in a deployment. This means that a single deployment can count for multiple groups of people in the breakdown table. Additionally, a person can be a member of multiple segments. These will cause the sum of successful production deployments in this breakdown to be slightly greater than the totals shown above.
Example: a ‘Manager’ segment where the manager is in their own team’s segment (e.g., Chris Riccio's Team), in addition to being part of their manager’s team (Joseph Levy's Team).
💡 Tip: If there are repositories or groups of people with low success rates and/or long Time to Deploy, then it could merit a conversation about what's leading to these statistics. There may be an opportunity to find process improvements that speed things up and improve developers experience.


