
Learn about how often deployments require remediation after the fact, and how that has changed over time
Trend
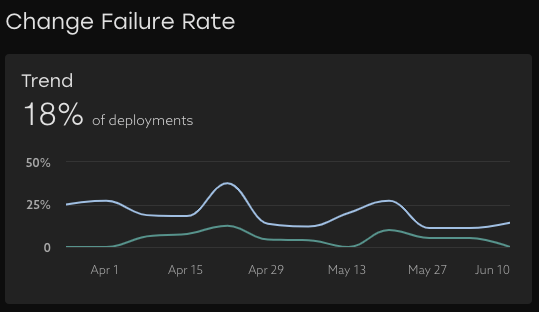
See how the Change Failure Rate has trended over time with the overall CFR shown in blue, as well as an "Urgent" CFR shown in green. Deployments including a remediation within 48 hours of the previous deployment are considered urgent.
💡Increases in either the overall CFR or Urgent CFR can surface reduction in quality over time, so track this metric closely, and consider putting a target for your team to track against.
Failures by Repository
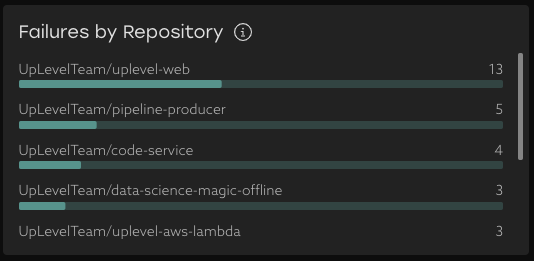
Observe where the failures are occurring to look for hotspots in your codebase. This bar chart indicates how many failures have occurred in a given repository, with the length of the horizontal line representing the proportion of failures across all repositories. Use this chart to determine how to mitigate risk from particularly troublesome parts of the codebase.
Breakdown Table
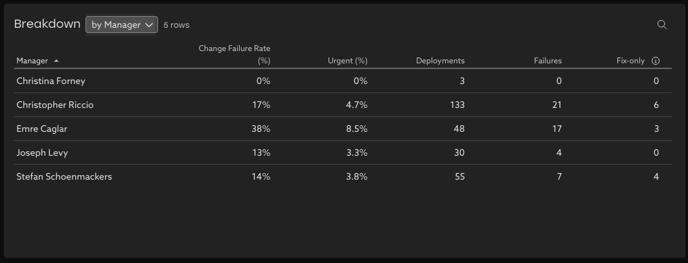 Explore the data to learn how frequently teams deployments require remediation by looking at the CFR(%), how often there was urgent remediation required, as well as the total number of Deployments, Failures (non-urgent), and Fix-Only deployments. This table can be pivoted both by people properties like team and report group.